A closer look at CAPE
US stocks are expensive today. One common way to measure how expensive is CAPE, the cyclically adjusted price-to-earnings ratio. Take the price of the S&P 500, the index of 500 large US companies. Divide it by their average yearly profit over the last 10 years, adjusted for inflation. The 10-year average smooths out good years and bad years. A high CAPE means you pay a lot for each dollar of profit.
Today CAPE is 41. Only the months around 2000 were higher.
The scary claim
Here is a claim people often quote. Since 1950, when CAPE was 30 or more, the S&P 500 fell 20% or more within the next 2 years 44% of the time. For any 2-year window, whatever the CAPE, the chance was 19%. So an expensive market seems to more than double the odds of a crash.
I wanted to know where the 44% comes from, so I counted it myself.
Where the 44% comes from
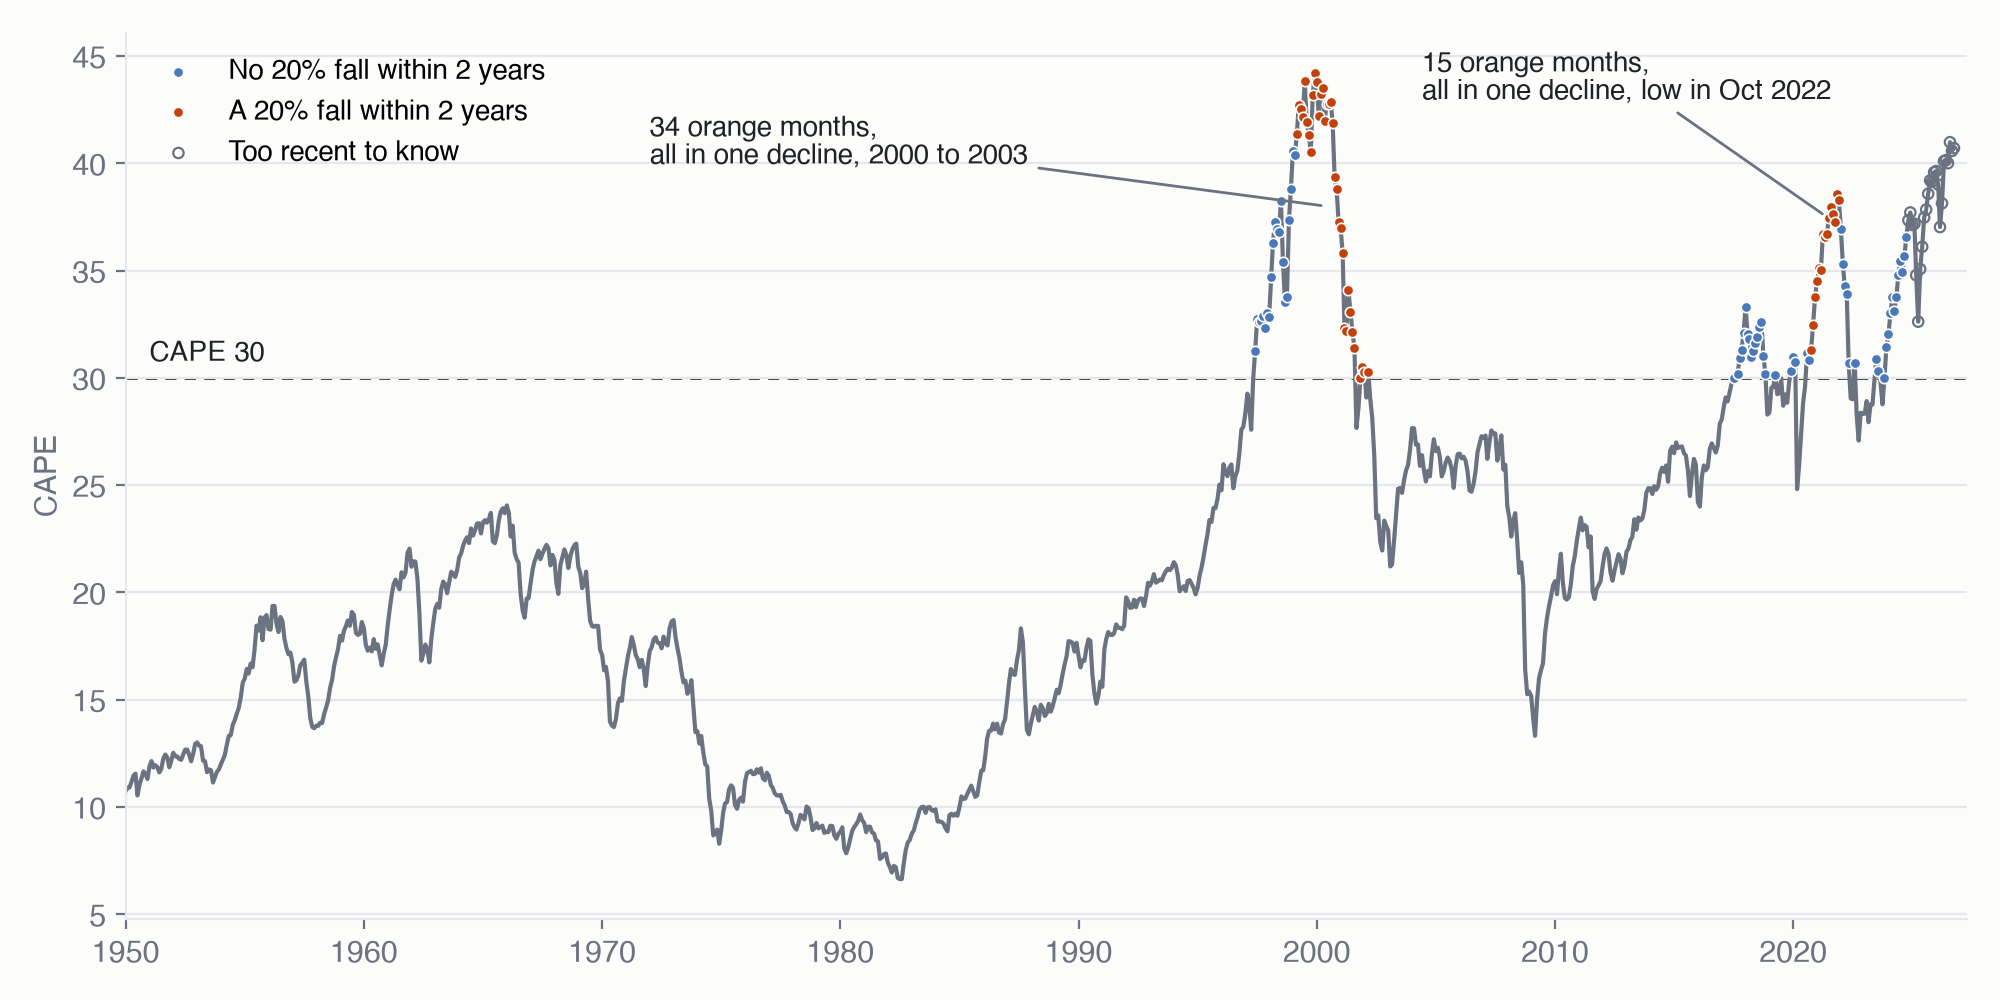 CAPE since 1950. Each dot is one month with CAPE at 30 or more. Orange: the S&P 500 fell 20% or more within the next 2 years. Blue: it did not. Hollow: less than 2 years have passed, so it is too early to know.
From 1950 to 2024, CAPE was 30 or more in 112 months. Those are the solid dots. The count stops in 2024 because each month needs 2 full years after it to check what happened. 49 of the 112 dots are orange. 49 divided by 112 is 44%. That is the whole calculation, and it looks like 49 pieces of evidence.
The 49 are 2 crashes
Now look at where the orange dots sit. There are only 2 groups.
The first group is 34 months, from March 1999 to March 2002. All 34 were followed by the same decline, the one from 2000 to 2003. The second group is 15 months in a row, from October 2020 to December 2021. All 15 were followed by the same decline, the one that hit its low in October 2022. 34 plus 15 is 49.
This happens because expensive markets stay expensive for years. Each month before a crash gets counted again, so one crash shows up as many orange dots. But March 1999 and April 1999 are not 2 separate tests. They had the same market, the same companies and the same crash.
The honest way to count is by episode. An episode is one long stretch of expensive market, counted once however many months it lasted. Counted that way, the 49 orange dots are 2 crashes. The sample size is 2, not 49.
What 2 crashes can tell you
The 2 crashes do say something. Both long expensive stretches had a 20% fall in them. That fits the common sense that high prices carry more risk.
But 2 cases cannot give you odds. One more crash, or one more expensive stretch without a crash, would move the 44% a lot. A number from 2 cases looks exact, but it is not.
The hopeful story has the same problem
People who are not worried about high prices often point to profits. US companies are making more money than ever. Their profits after tax are 11.9% of the whole US economy, the highest share since 1947. The claim is simple: when profits are this high, high prices are safer.
At first, history seems to agree. Take every quarter since the 1950s when stocks were very expensive, meaning CAPE was in the top fifth of its history so far. There are 127 of them. Sort them into two groups by profits:
| Profits | Quarters | Yearly return over the next 10 years, after inflation |
|---|---|---|
| High | 43 | 7.0% |
| Low | 84 | 3.0% |
High profits look much better. Now do the same check as before. Where do the 43 high-profit quarters come from?
| When | Quarters | Yearly return over the next 10 years, after inflation |
|---|---|---|
| 2004 to 2016 | 37 | 8.3% |
| 1965 to 1966 | 6 | -1.1% |
37 of the 43 come from one stretch, 2004 to 2016. So the good result is one period of history, not 43 separate cases.
That period had something else too. After 2009, interest rates after inflation stayed near zero for years. So we cannot tell what made 2004 to 2016 good: the high profits, or the low rates. A better test has started. Since late 2023, profits have been high and interest rates after inflation have been 1.5% or more. Their 10-year results arrive in 2033.
What is left
Counted by episode, both the scary claim and the hopeful claim become much weaker. What is left is slower and less exciting: the price says something about the next 10 years.
The rule is 1 divided by CAPE. At a CAPE of 41, you pay $41 for each $1 of average yearly profit, and $1 is about 2.5% of $41. Read that 2.5% as the expected yearly return after inflation over the next 10 years. The average 10-year return since 1958 was 6.3% a year. So today’s price points to a weak decade.
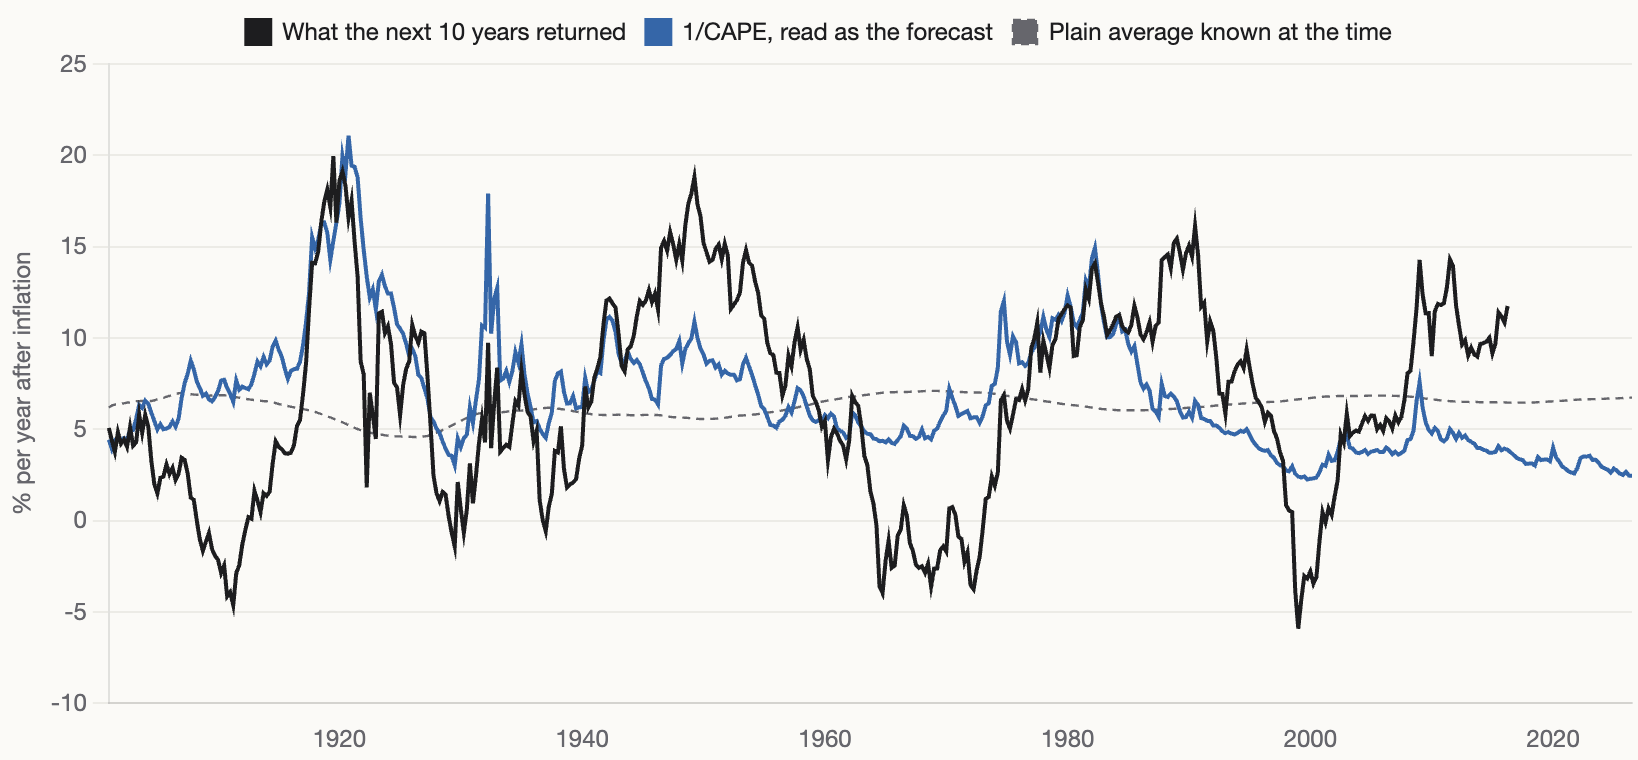 Black: what the next 10 years returned, in % a year after inflation. Blue: 1/CAPE read as the forecast. Dashed: the average return known up to that date.
The rule rarely gets the number right. Its typical miss is about 5 percentage points a year. But it usually gets the direction right: expensive starts led to weak decades, and cheap starts to strong ones. One big miss is recent. For start dates from 2006 to 2016, the rule expected 4.4% a year on average, and stocks returned 9.8%. You can see that gap at the right end of the chart.
So 2.5% means “probably below average” over 10 years. It is not a crash warning. For the next 2 years, history gives only 2 crashes to learn from, and nothing I found tells you when the next one will come.